Street intersection with object detection overlays

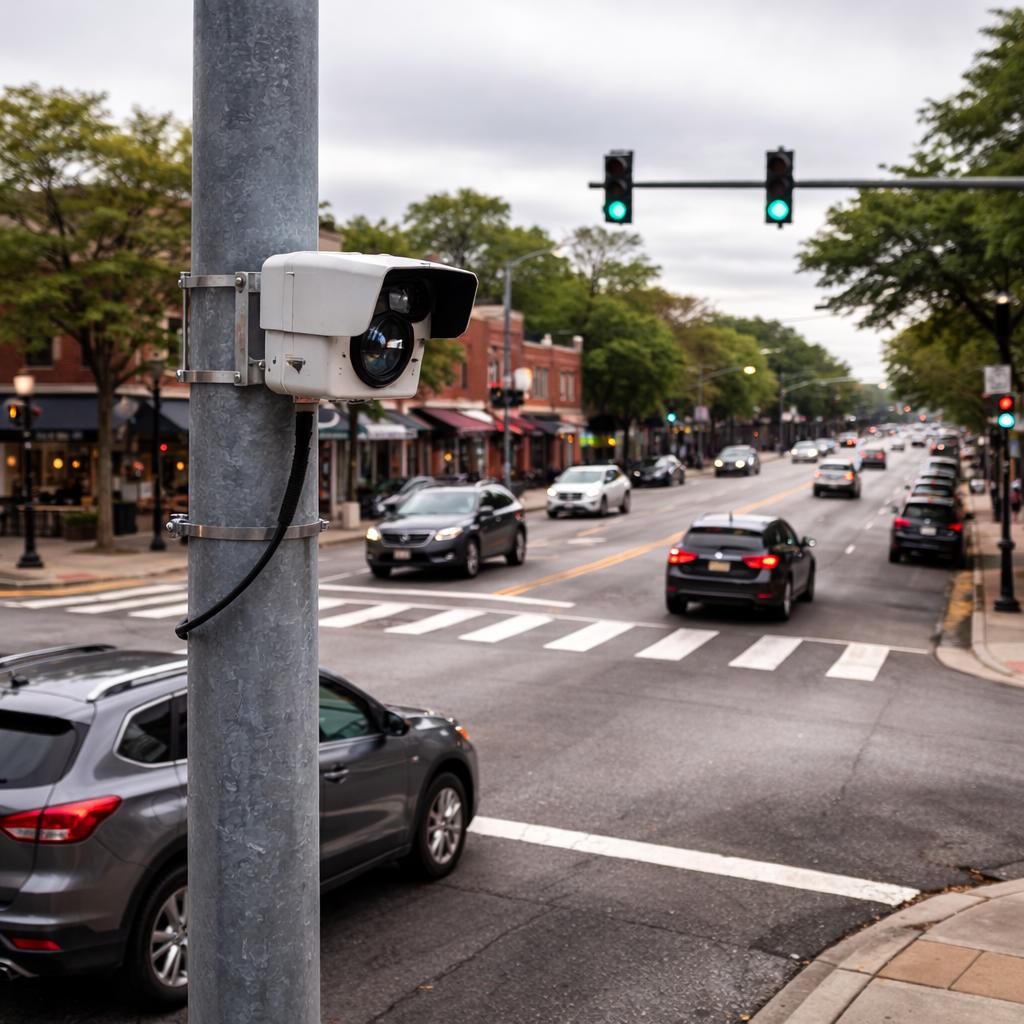
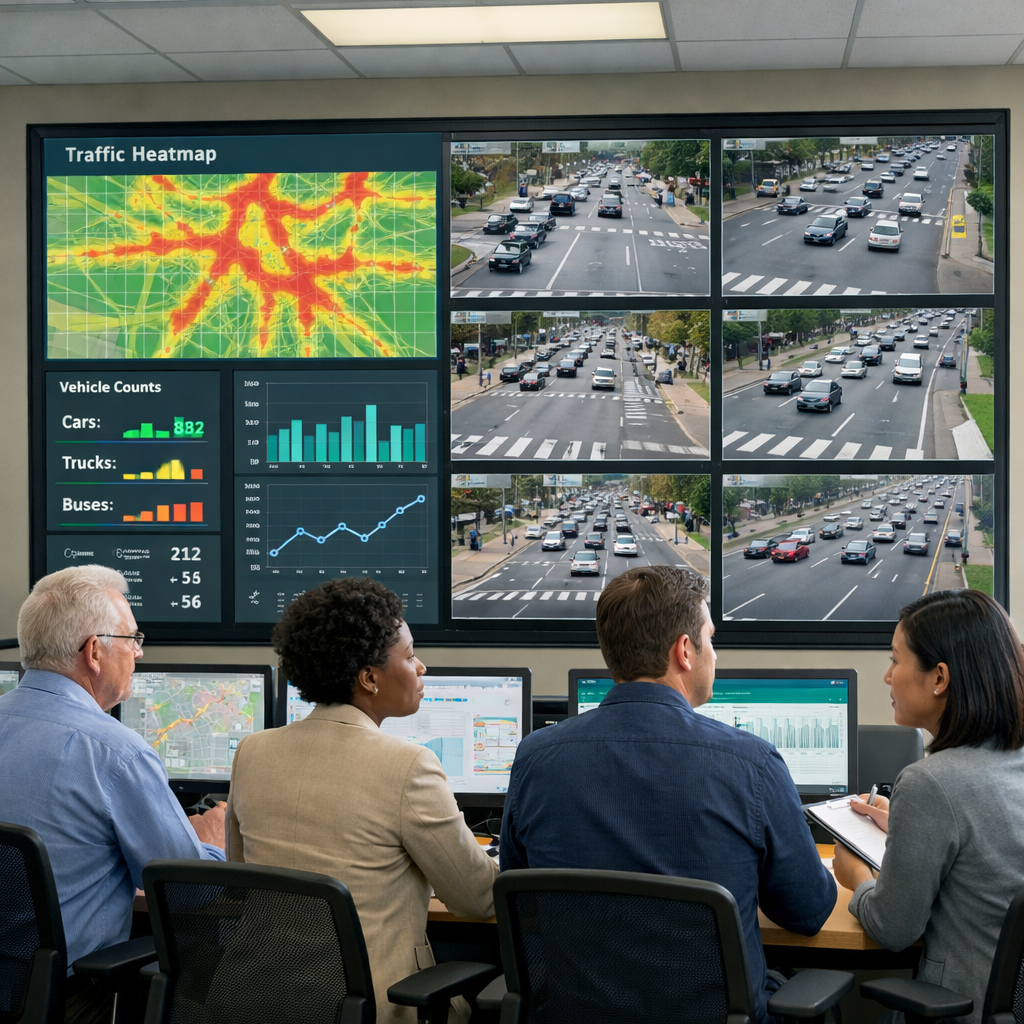
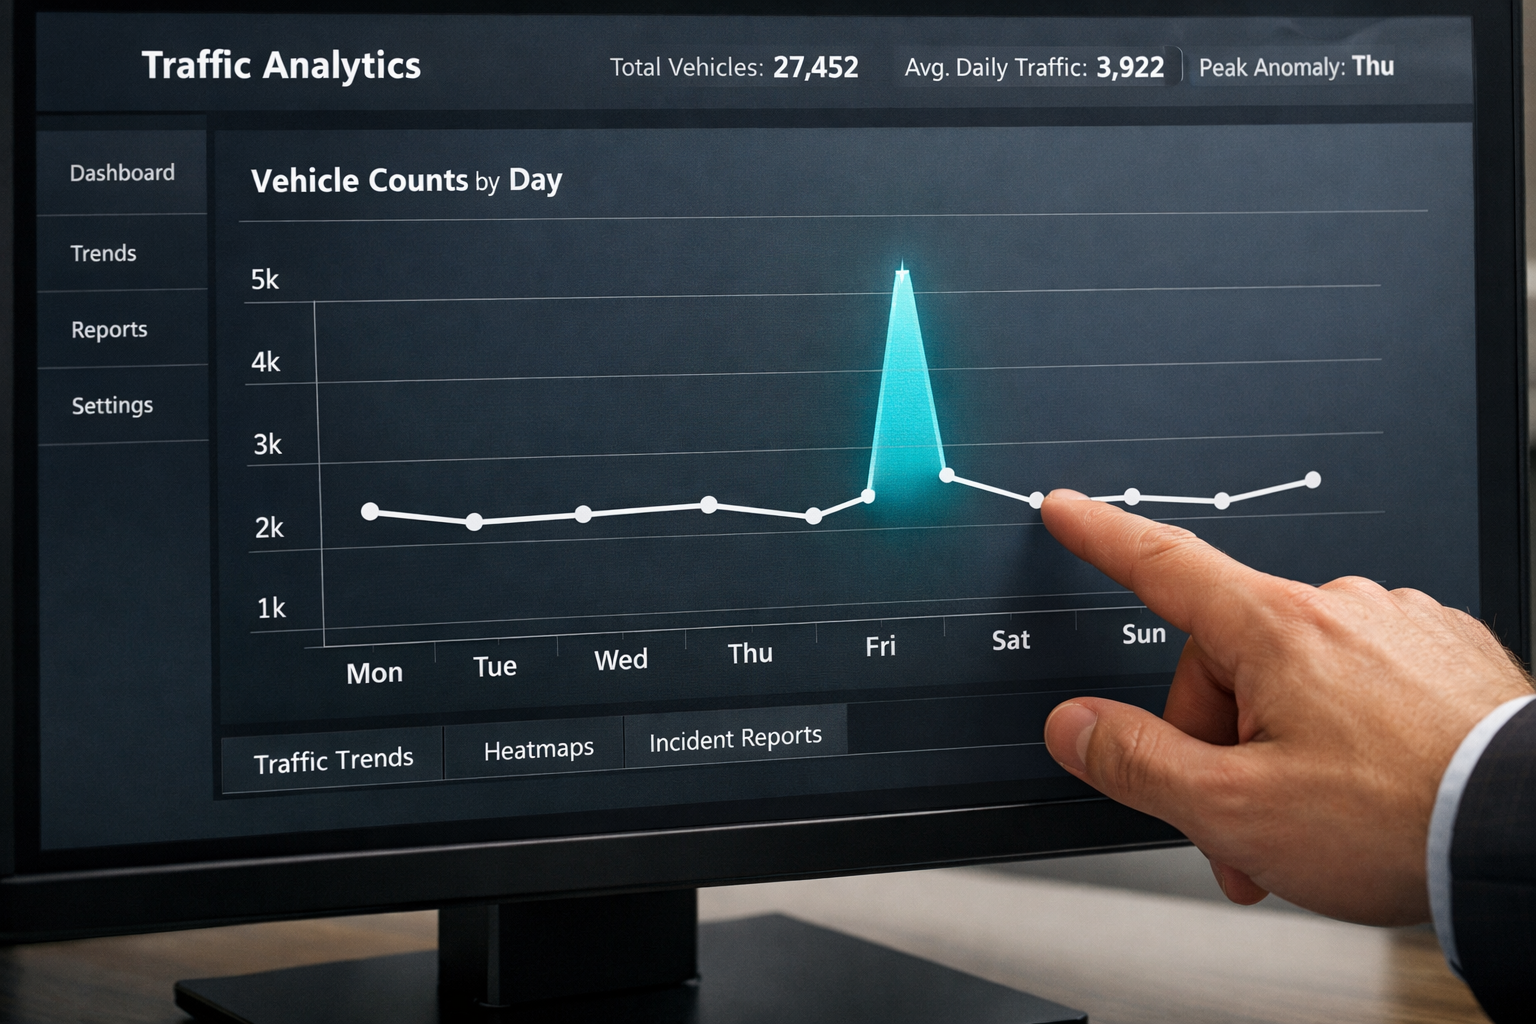
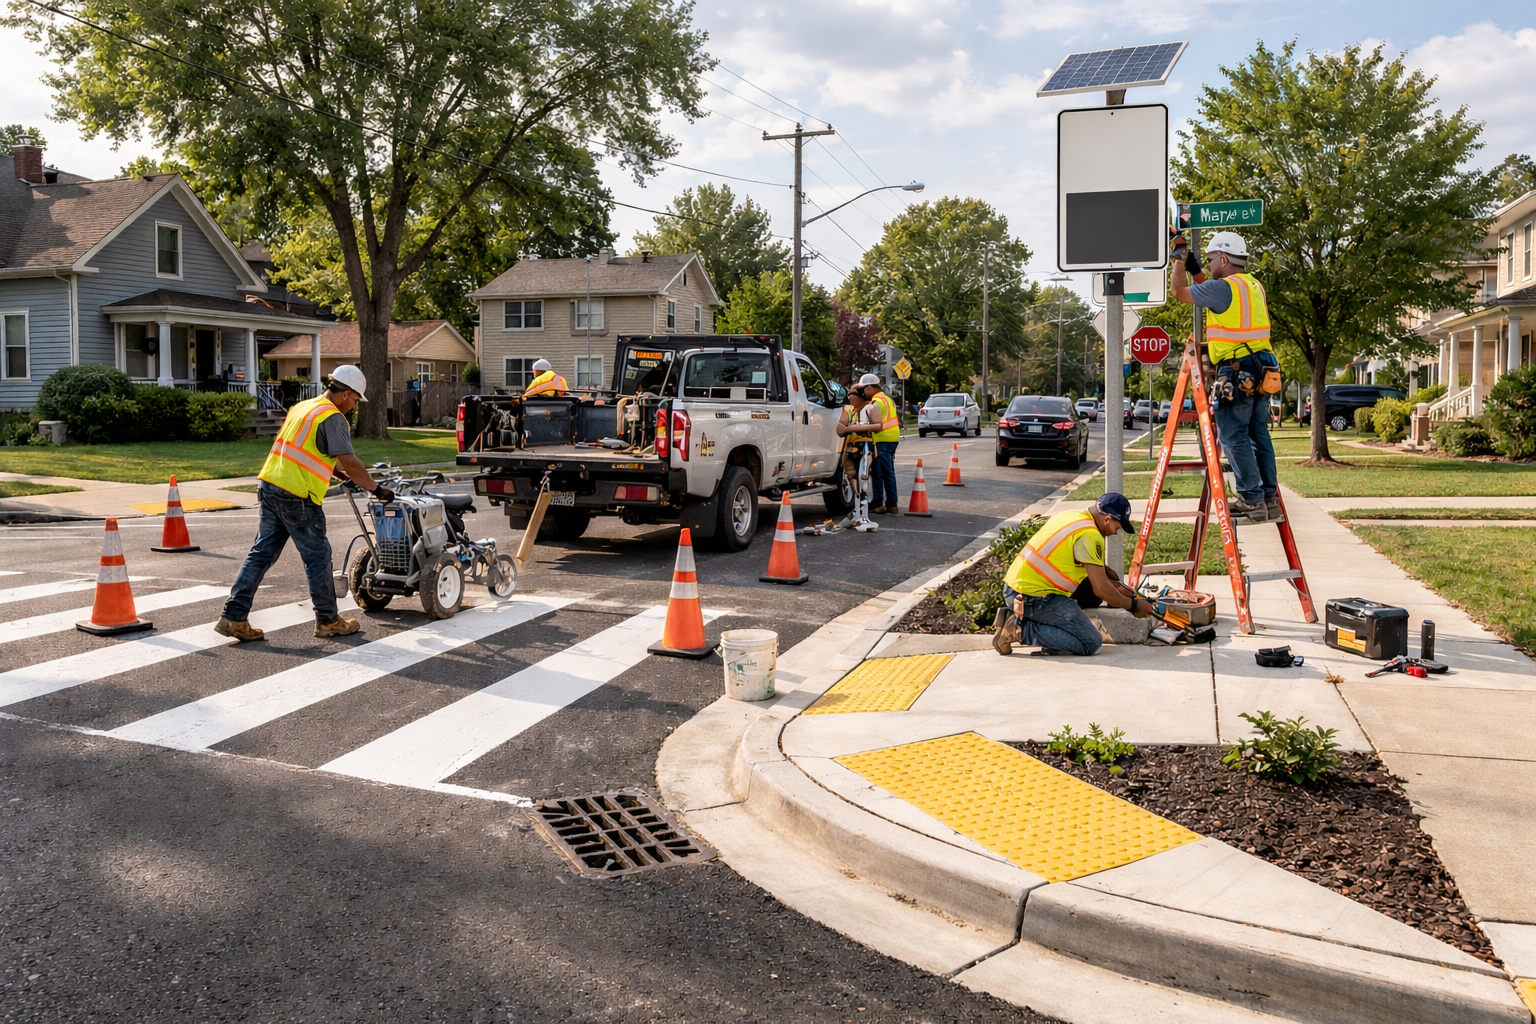
Turn your existing camera network into measurable civic intelligence

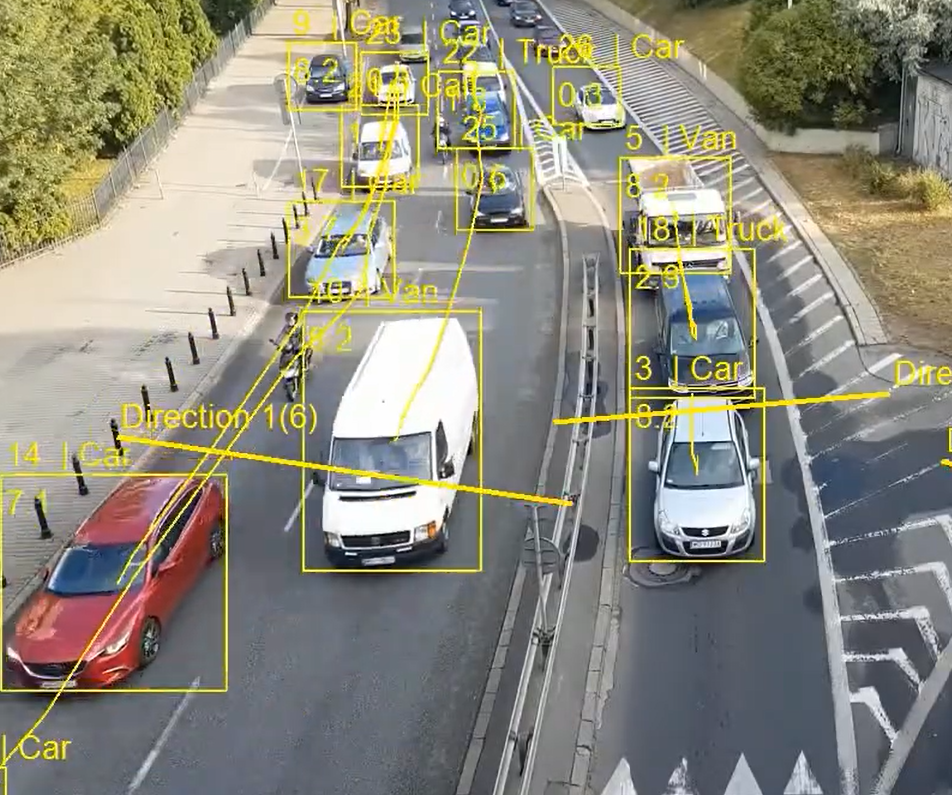
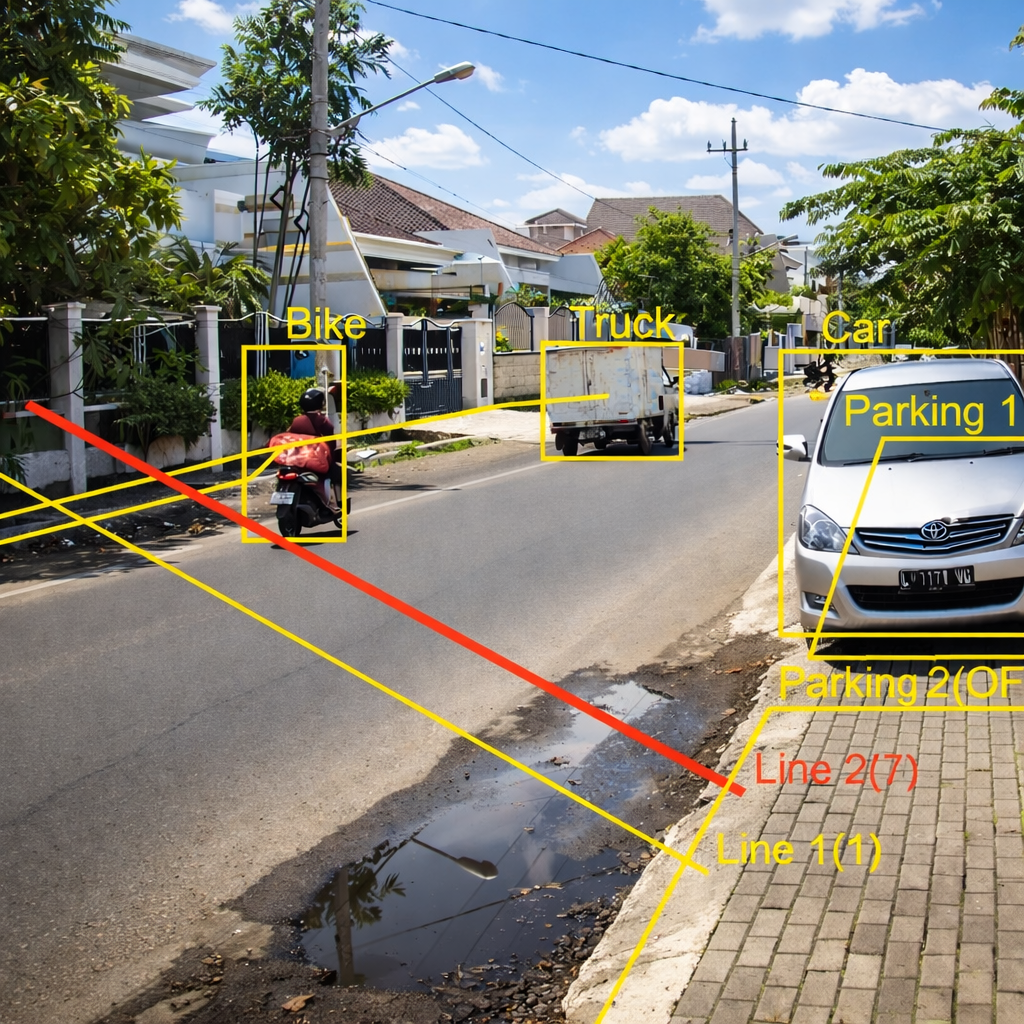
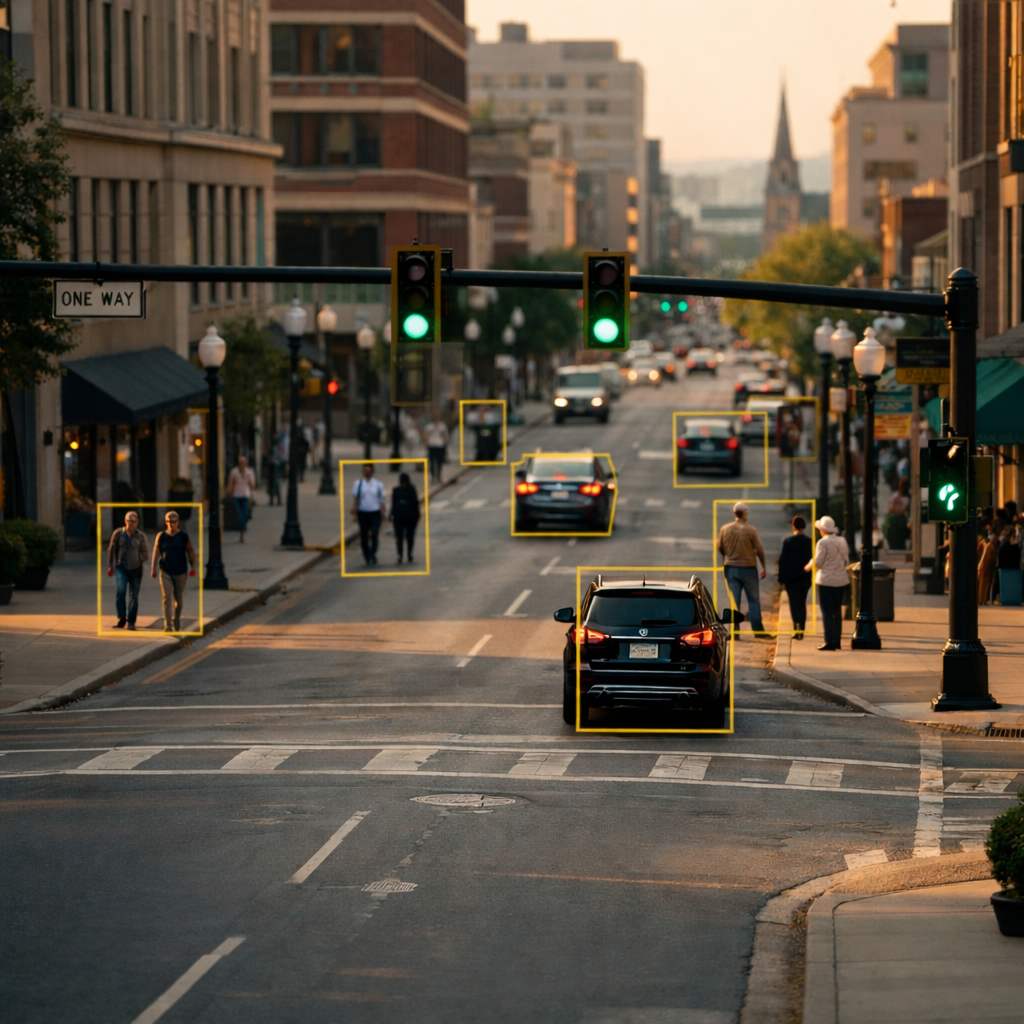
Municipal leaders across the country are using existing camera networks to understand their cities in ways that were not possible before. From traffic engineering to public safety to budget planning, DashDotData transforms footage into facts—the kind of facts that guide real decisions about where to calm traffic, how to deploy resources, and what infrastructure actually needs to change.

Request a walkthrough

The cameras exist. The answers don't.

Most cities already have cameras focused on key intersections and roads. What they don't have is structured visibility into what those cameras are seeing. You're left making decisions about traffic, safety, and infrastructure without knowing the one thing that matters most: what's actually happening on your streets.

  • Vehicle and pedestrian traffic patterns remain unquantified and invisible
  • Speed trends go unmeasured
  • Safety issues go undetected
  • Planning and infrastructure decisions lack real data
Traffic camera mounted on a pole overlooking a city street

Bring all your camera data together to truly see your city for the first time

DashDotData synthesizes the data from your city's entire camera network, then shows you exactly how to use these measurements to calm traffic, prioritize where officers work, justify infrastructure spending, attract investment, and build the trust your community deserves.

  • Calm traffic with evidence-based speed and flow interventions
  • Direct enforcement resources to streets that need them most
  • Secure funding and community support for infrastructure projects
Team reviewing traffic analytics on large monitor wall

The numbers that matter most

Your cameras capture everything, and DashDotData translates that footage into concrete measurements that reveal how your streets actually function.

Pedestrian and vehicle tracking

Track hourly, daily and seasonal traffic patterns with precision.

Vehicle counts and classification

Separate cars, trucks, buses and more to understand true roadway composition.

Speed distributions and flow

See how fast vehicles are moving and where congestion exists on your streets.

From data to decision

We follow a clear path: establish a baseline, show traffic trends visually, identify outliers, extract the insight, then help you act on it. The result is a repeatable, transparent framework for city-wide operational decision-making.

01
Analyst reviewing baseline data

Establish a baseline

Determine what "normal" looks like at each camera location

02
Team visualizing traffic findings

Visualize the findings

Identify traffic patterns, trends and variations

03
Extracting key insights from data

Extract the insights

Highlight statistically meaningful outliers

04
Construction crew taking action

Take measurable action

Deploy strategies and resources backed by data

What happens when your city actually knows

Cities using DashDotData reduce guesswork and shorten planning cycles. Interventions become targeted. Budget requests become defensible. Community trust increases.

Shorter planning cycles

Replace months of debate with weeks of implementation backed by evidence.

More effective resource deployment

Put the right resources in the right places — with measurable justification.

Stronger grant applications

Grant applications and budget requests land because the data speaks for itself.

Aerial view of city intersection with object detection overlays
Street camera with detection overlays

The cost of waiting

Every month without visibility into your streets is a month of decisions made blind. Traffic calming efforts miss their mark, enforcement resources scatter across the wrong locations, and infrastructure spending gets justified by hope instead of hard evidence.

Traditional traffic studies are slow and expensive

State transportation departments can run the studies that measure what you need to know, but they take years, cost tens of thousands of dollars and still cannot provide the depth of detail that our camera analytics can. Your city's cameras could answer the same questions in weeks.

Your data is already there

The cameras exist. The traffic patterns and outliers are happening right now. DashDotData simply unlocks what your cameras have been capturing all along, turning your camera network into immediate insight.

Questions

Everything you need to know about how DashDotData works and what it means for your city, borough or municipality.

We never store faces or identify individuals. We quantify and classify vehicle and pedestrian movement at an aggregate level.

Most municipal camera networks work with our system. We handle standard IP cameras and legacy systems alike.

A pilot typically runs in weeks, not months. We help with the technical work so you focus on the insights.

Yes. Speed data, traffic flow patterns, and violation hotspots help you strategically deploy resources where they matter most.

Your city owns the data. You control access, retention, and how it's used. Full transparency, no surprises.

Absolutely. Whether you have five cameras or five hundred, the system scales to your needs and budget.

Still have questions?

Reach out to our team. We're here to talk through your specific situation.

Schedule a 30-minute pilot review

Enter your name and email and we'll send you everything you need to schedule your personalized walkthrough and Q&A session.

You're on the list.

We'll be in touch shortly with everything you need to schedule your walkthrough.

By submitting this form you agree to our terms and privacy policy.